Atty Algo Pack

Trading tools built from research we publish.

Four TradingView tools, each tested on years of real market data before it ships. Backtests include commission and slippage, the settings are disclosed, and the research behind every tool is public, including the results that didn't hold up.

Two tools trade: Stampede and SDP ATR. Two measure: Execution Reality and Session Map. One subscription covers all four.

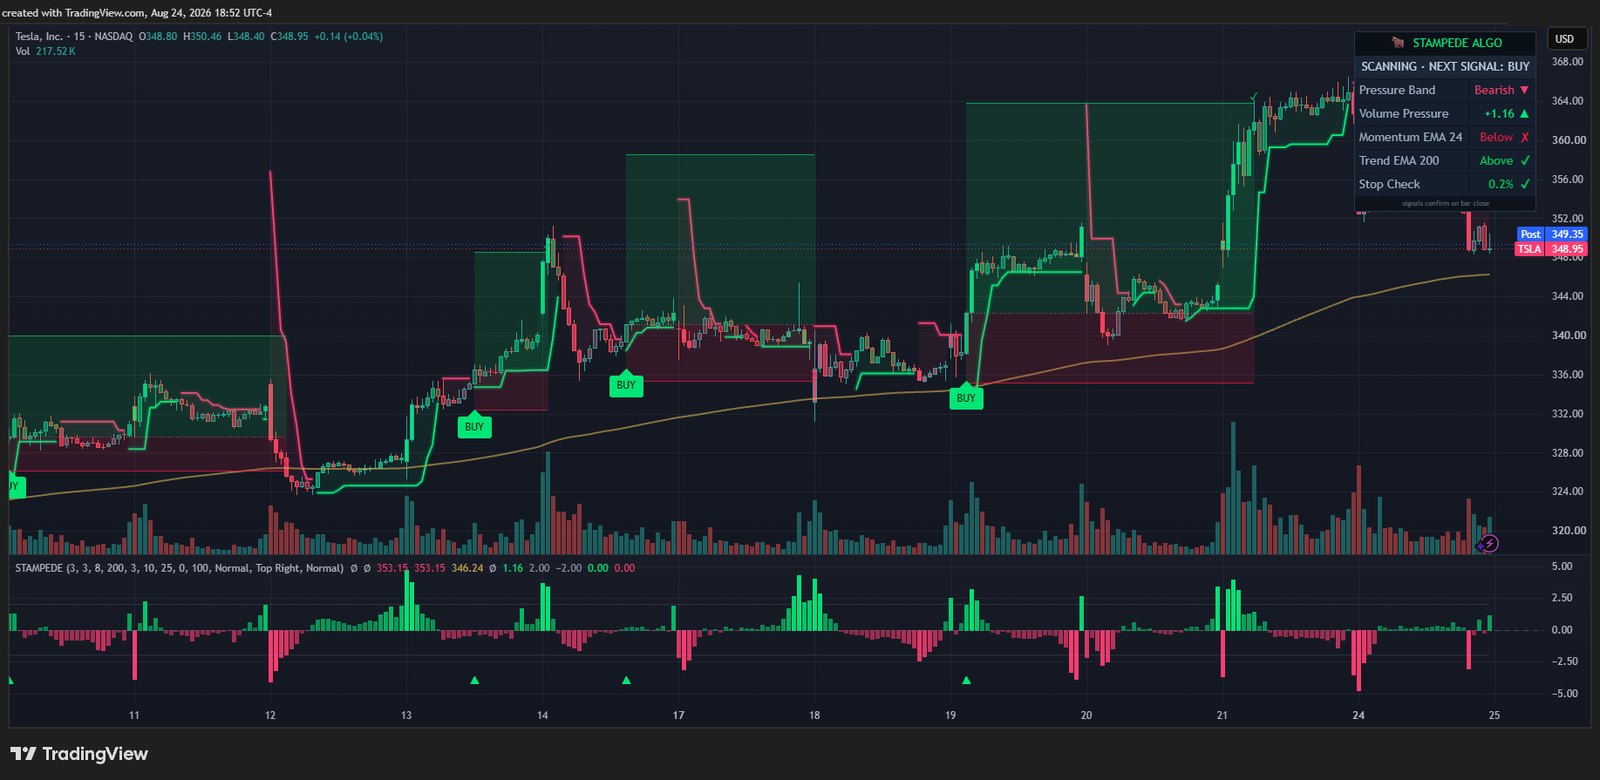
Atty Stampede Algo · TSLA 15-minute · bar replay · real signal, real frames
Recorded frame by frame through TradingView's bar-replay tool. The signal prints at bar close, the stop and the target draw themselves, then the run to target.
4tools in the pack today
5markets in Stampede's backtest, costs included
1,289sessions Session Map is graded on, walk-forward
4research articles published, method included
Backtested in the open

Stampede: same settings, five markets, full stats.

Straight from TradingView's Strategy Tester. One frozen configuration on every symbol, commission and slippage included.

How these were produced: TradingView Strategy Tester · Jul 3, 2023 – Aug 24, 2026 · 15-minute chart · $100,000 simulated account · fixed order size (100 shares; GME 1,000 due to share price) · $0.005/share commission · 1 tick slippage · limit entries. These are hypothetical results on historical data — they are not real trading, and past performance does not indicate future results. Full CFTC Rule 4.41 disclosure in our Risk Disclaimer.
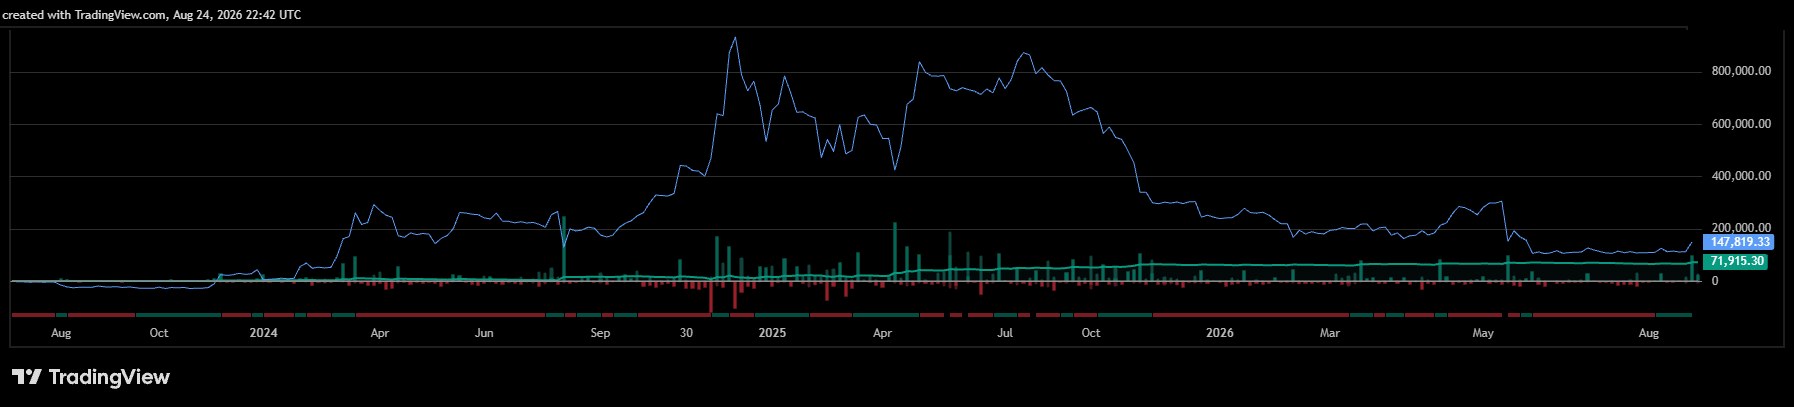
MSTRStrategy Inc · NASDAQ+$71,916
1.64Profit factor
275Trades
+71.9%Net return
11.0%Max drawdown
MSTR hypothetical equity curve from TradingView's strategy tester
100 shares/trade · 28.7% of trades hit targetView tester screenshot ↗
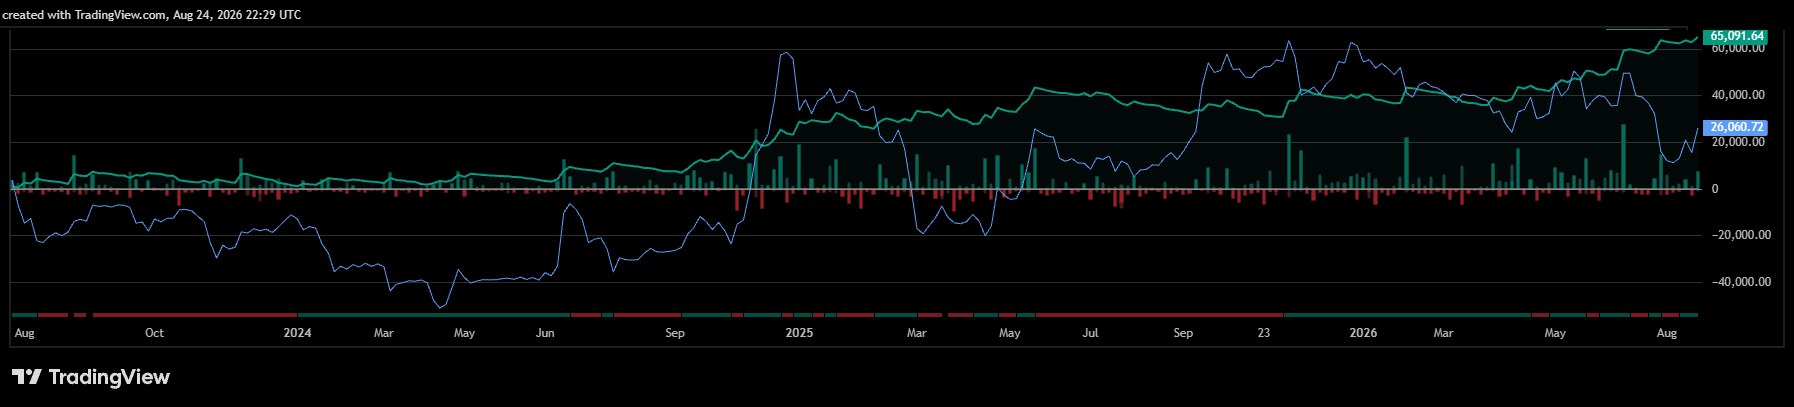
TSLATesla, Inc · NASDAQ+$65,091
1.55Profit factor
273Trades
+65.1%Net return
9.4%Max drawdown
TSLA hypothetical equity curve from TradingView's strategy tester
100 shares/trade · 30.4% of trades hit targetView tester screenshot ↗
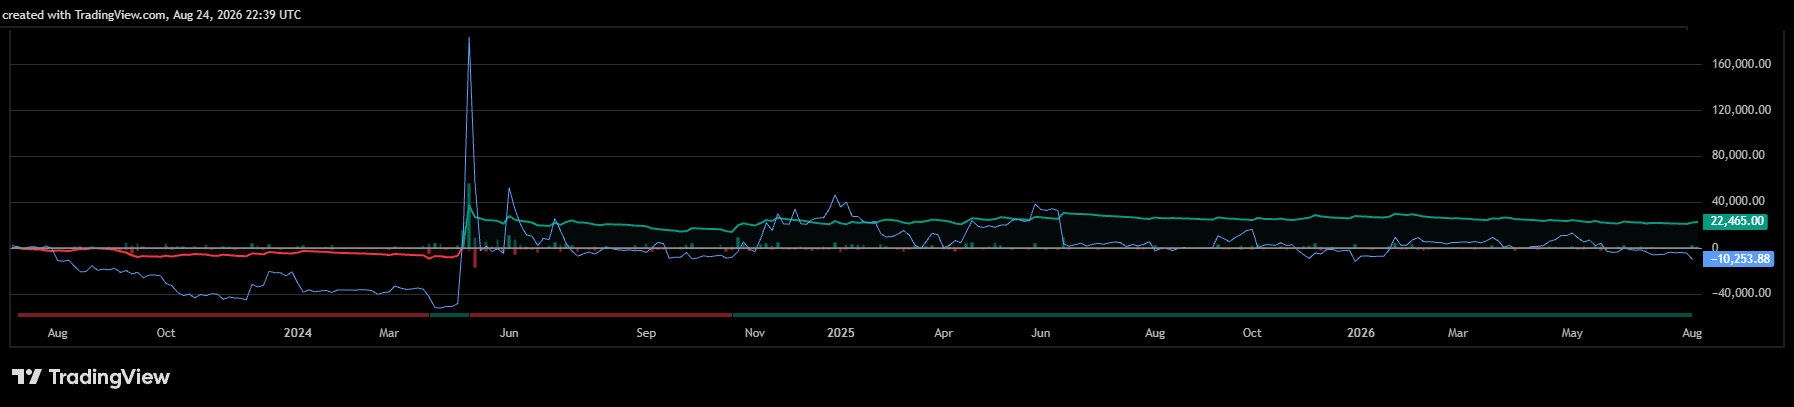
GMEGameStop Corp · NYSE+$22,475
1.17Profit factor
295Trades
+22.5%Net return
17.4%Max drawdown
GME hypothetical equity curve from TradingView's strategy tester
1,000 shares/trade · 23.7% of trades hit targetView tester screenshot ↗
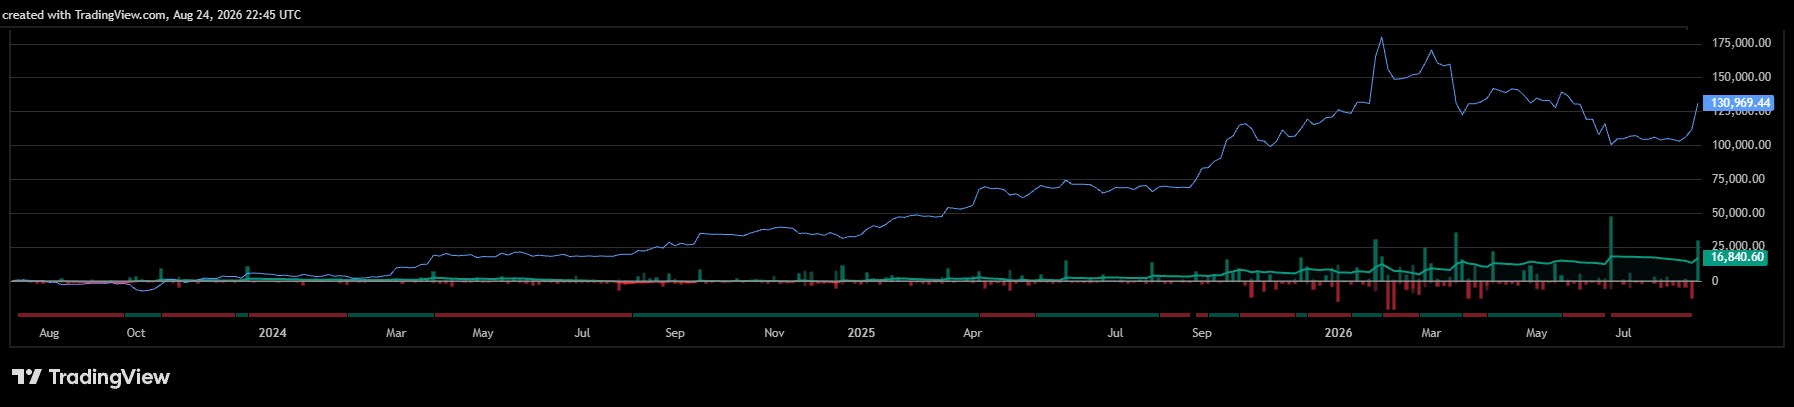
GLDSPDR Gold Shares · AMEX+$16,841
1.33Profit factor
273Trades
+16.8%Net return
7.2%Max drawdown
GLD hypothetical equity curve from TradingView's strategy tester
100 shares/trade · 27.8% of trades hit targetView tester screenshot ↗
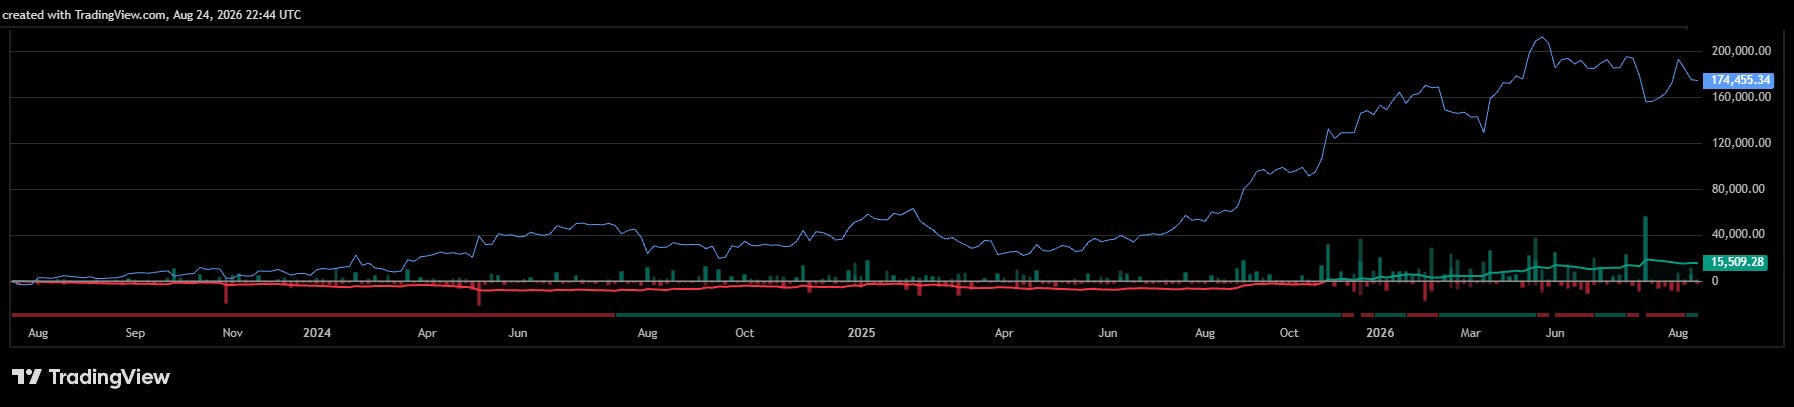
GOOGLAlphabet Inc · NASDAQ+$15,509
1.29Profit factor
261Trades
+15.5%Net return
8.7%Max drawdown
GOOGL hypothetical equity curve from TradingView's strategy tester
100 shares/trade · 28.4% of trades hit targetView tester screenshot ↗

Why these five?

Stampede hunts crowd surges, so it lives where crowds trade: liquid, volatile names with real participation. High-volume momentum stocks and gold are where it validated best.

Winners here are roughly 3× the size of losers by design — the algo pays for many small stops with fewer, larger target hits. That's why a sub-30% win rate can carry a positive expectancy.

What's in the pack

Two tools that trade. Two that measure.

Stampede prints signals with a stop and target on every one. SDP/ATR is a strategy, and it is labelled as one everywhere it appears. Execution Reality and Session Map have no entries and never will.

01

Atty Execution Reality

ATTY EXEC

Point it at any level — prior day high, overnight low, or any other indicator's plot — and it tells you how often price actually traded to it versus gapped straight past, what the slippage really was, and whether the move you are playing for is even bigger than the round turn.

Effective spread is recovered from open, high, low and close alone — no tick data, no order book — using a method published in the peer-reviewed literature and validated here against a synthetic bid-ask bounce with a known answer. On ES one-minute bars it reads 0.89 ticks, which is correct: ES is one tick wide nearly all the time.

The fill shadow is the band beyond each level covering where fills have actually landed. The line is what you hoped for. The shadow is what you get.
PDH 16% gap where fills land cost floor gap EXECUTION REALITY MES1! 5 spread 5.3 t $6.62 wide for tf commission $1.24 ROUND TURN 6.29 t $7.86 per contract LEVEL reached gapped 95% CI p90 slip PDH33 58%41-73 359 t PDL43 53%39-67 251 t ONH36 11%4-25 45 t ONL42 7%2-19 0 t
Drawn to match the panel's real output. Figures are an actual reading, MES1! 5-minute.
02

Atty Session Map

ATTY SESSION

At 10:42 on a Tuesday, how much more range is normally left in this day, and how unusual is what has already happened? The answer comes as percentile bands read off the clock, not an average — and the comparison set is chosen so a quiet Tuesday is never measured against an FOMC Wednesday.

We tested session direction forecasting first and refuted it: the state of the Asia and London sessions carries no information about New York's direction (chi-square p = 0.44), and trading it walk-forward lost $7.27 a trade against $3.26 for simply being long.

It grades itself, and we published the grade. Walk-forward across 1,289 sessions, the band covers 48–52% against a nominal 50% from the open through to early afternoon — calibrated to within about a point. Later in the day it drifts wide, because by then most sessions have already made their range, and a percentile band on a range that has stopped moving means nothing. So the tool stops drawing one and tells you the range is set instead.
now 11:00 P90 P75 P10 sample in bucket 118 TYPICAL DAY 50.50 CALIBRATION band is honest 50%
Redrawn from the walk-forward calibration run: at 11:00 on ES the band covers 50.2% against a nominal 50%, and the typical day is 50.50 points.
03

Atty SDP ATR Algo

ATTY SDPATR  ·  strategy, not an indicator

Scan first. Then put the plan on the chart. Find symbols whose last completed session moved at least one prior ATR(5) from the session close before it. Open those charts, apply the strategy, and it names the setup that qualifies, draws its limit entry and its fixed stop, and manages the exit. When a limit fills, a solid BUY or SELL tag marks the fill, and the exit is tagged with its result in R.

Four setups: Second Day Long, Second Day Short, ATR Long Reversal, ATR Short Reversal. Second Day plays enter at the prior session's midpoint and stop at the prior opposite extreme. ATR reversals enter half an updated ATR beyond the prior extreme and stop 3.5 ATR beyond the anchored one. When both directions qualify, the first fill cancels its sibling.

Exit rules — there is no take-profit order. A position leaves on its fixed protective stop, or on a scheduled flatten one minute before the reference session closes: 15:59 New York on US stocks and ETFs, 14:59 Chicago on ES, 12:29 on GC, 13:29 on CL. No target order, no trailing stop, no break-even move. The recovery line it draws is a labelled reference to the prior session's extreme — price touching it closes nothing.

The scanner is yours and it lives outside the chart. This strategy evaluates one loaded symbol; it does not search a universe. A screener's percent-change and relative-volume columns will get you a shortlist, but they are not the same arithmetic — the strategy panel is the exact eligibility check, and the Second Day plays additionally need the close in the outer quarter of the setup range and setup volume at 1.20× the median of the prior twenty sessions.

Researched on ES, gold and crude — and that is the scope we claim. What it gives you is one consistent way to display, simulate and record the playbook on whatever charts your scanner hands you, with the same eligibility arithmetic every time.
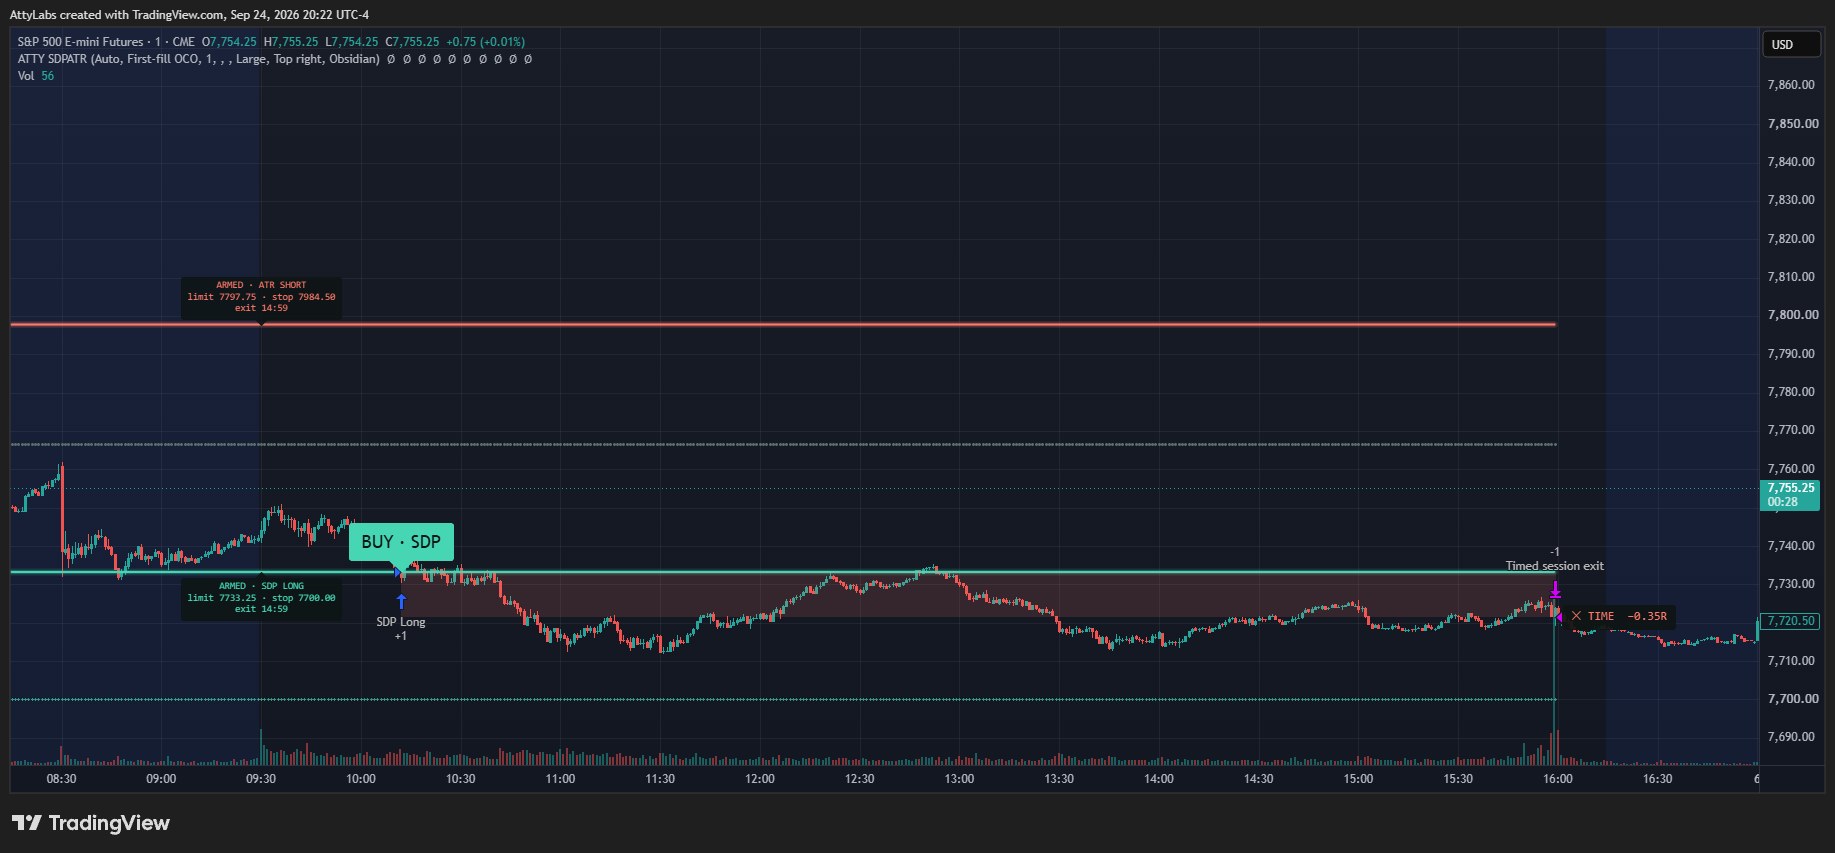
Atty SDP ATR Algo v1.1.0 on a one-minute ES chart for 4 September 2026. Two dark ARMED chips mark the pre-open plans: ATR Short, limit 7797.75, stop 7984.50, and SDP Long, limit 7733.25, stop 7700.00, both exiting 14:59 Chicago. A solid green BUY · SDP tag points at the SDP Long fill mid-morning. A red-shaded box runs from the fill to the scheduled exit, where a tag reads ✕ TIME −0.35R.
v1.1.0 on ES1! one-minute, session of 4 September 2026 (image exported 24 September). The prior session closed strong and clean, so two cards armed before the open. Price came down to the SDP Long limit at 7,733.25 mid-morning: the solid BUY · SDP tag marks the fill, which cancelled the ATR Short order. The position was flattened at the scheduled exit, not at a target, for −0.35R. One session, picked because a card filled; it was the only fill in the chart's one-minute history when the image was made. TradingView broker-emulator simulation on one contract, not a performance claim.
04

Atty Stampede Algo

STAMPEDE  ·  signals, stop and target on every one

Measures how hard volume is pushing price, and which way. When pressure breaks the adaptive band and both trend gates agree, it prints BUY or SELL at bar close and draws the stop and target automatically. Signals lock in when the bar closes and never repaint.

Backtested on five markets with commission and slippage included and every setting disclosed. The full tester record, screenshots included, is on its own page.

It places no orders. Stampede draws signals, stops and targets on your chart and can fire alerts. What you do with them is your decision.
Atty Stampede Algo on a TSLA 15-minute chart with the band, signal, stop and target drawn
Atty Stampede Algo on TSLA, 15-minute bars: the adaptive band, a signal at bar close, and its stop and target zones.
How we test

A t-statistic of +5.24 that was pure fiction

One of the claims we tested was that price digs a fixed distance beyond a prior high or low before reversing. Fading it lost money at every depth, so the claim as written was dead. Then we tested the inverse.

Sweep continuation came back at +$10.05 per MES trade on ES and +$60.46 on NQ. Symmetric across long and short, so not drift. Stable across both halves of the sample and improving in the second. Consistent year by year. 1,566 events.

Every diagnostic we normally trust said it was real.

It was a fill artifact. 110 of 690 ES entries and 175 of 876 NQ entries were on bars that opened already through the level. You could never have been filled there.

Force the fill to be no better than the entry bar's open, and the edge inverts:

Fill assumptionES $/tradeNQ $/trade
At the level — the naive assumption+$10.05+$60.46
No better than the bar open−$2.36−$9.52
+ 1 tick−$3.61−$10.77
+ 2 ticks−$4.86−$12.02
+ 4 ticks−$7.36−$14.52

Negative at every hold from 3 to 120 minutes, at every depth from 5 to 180 points, and in five of six years on ES. Nothing but the fill check caught it.

Any tool that draws a level and assumes you trade at it can make the same mistake. That is why every tool in this pack is held to the fill check: Execution Reality exists to measure it on your own levels, and the two tools that trade are built to the same fill rules that killed the 5.24.

Read this before you buy

What the Algo Pack does not do

Two of the four give you no entries

There is no buy arrow anywhere in Execution Reality or Session Map, and neither has a setting that turns one on. Stampede prints BUY and SELL labels with a stop and target; it places no orders. Atty SDP ATR Algo is the only thing here that places an order — a simulated one, on charts you selected with an external scanner.

It makes no performance claim

The measurement tools have no backtested return attached, because they take no trades. The numbers on this page are measurements of the market and of other people's claims, not of our own profitability. SDP/ATR has been researched on ES, gold and crude only, on limited samples; a scanner-selected stock universe has not been validated, and we do not quote the futures figures as if they were the stock result.

It will tell you when it cannot read

"Not readable now" is a first-class output in every tool. A bucket with 14 samples says so instead of drawing a confident line through 14 samples.

It only describes what ships today

Every tool on this page is live on TradingView now. When a new tool joins the pack, it is added to your subscription at no extra cost; nothing is described here as shipping until it does.

Pricing

One pack, every tool. Pick how you pay.

Every plan includes the same four tools and everything added later. Access is delivered to your TradingView username and works on any TradingView plan, including free.

Monthly

$89 / month
Cancel anytime
  • All four tools, invite-only
  • New tools as they land
  • All future updates
  • Email support
Renews monthly · cancel anytime

3 Months

$231 / 3 months
$77 a month
  • All four tools, invite-only
  • New tools as they land
  • All future updates
  • Email support
Renews every 3 months · cancel anytime

Lifetime

$1,280 one time
One payment, no renewals
  • All four tools, invite-only
  • New tools as they land
  • All future updates
  • Priority email support
One TradingView username · what Lifetime means

The pack grows. More tools are on the way, existing ones keep getting sharper, and every addition lands in your subscription at no extra cost.

Atty Labs is not an investment adviser. Nothing here is financial advice or a recommendation to trade. The measurement tools take no trades; SDP/ATR simulates a plan on a chart and is connected to no broker. Every decision remains entirely yours. See the disclaimer, terms and refund policy.