Atty SDP ATR Algo — scanner and trading guide
Version 1.1.0 · updated 24 September 2026 (first published 16 September) · paid, invite-only on TradingView, included in the Atty Algo Pack
Scan first. Then put the plan on the chart. The scanner finds the symbols. The strategy turns one of those charts into a named next-session trade plan: a limit entry, a fixed stop and a scheduled exit. This page is the whole workflow, including the exact arithmetic your scan has to reproduce.
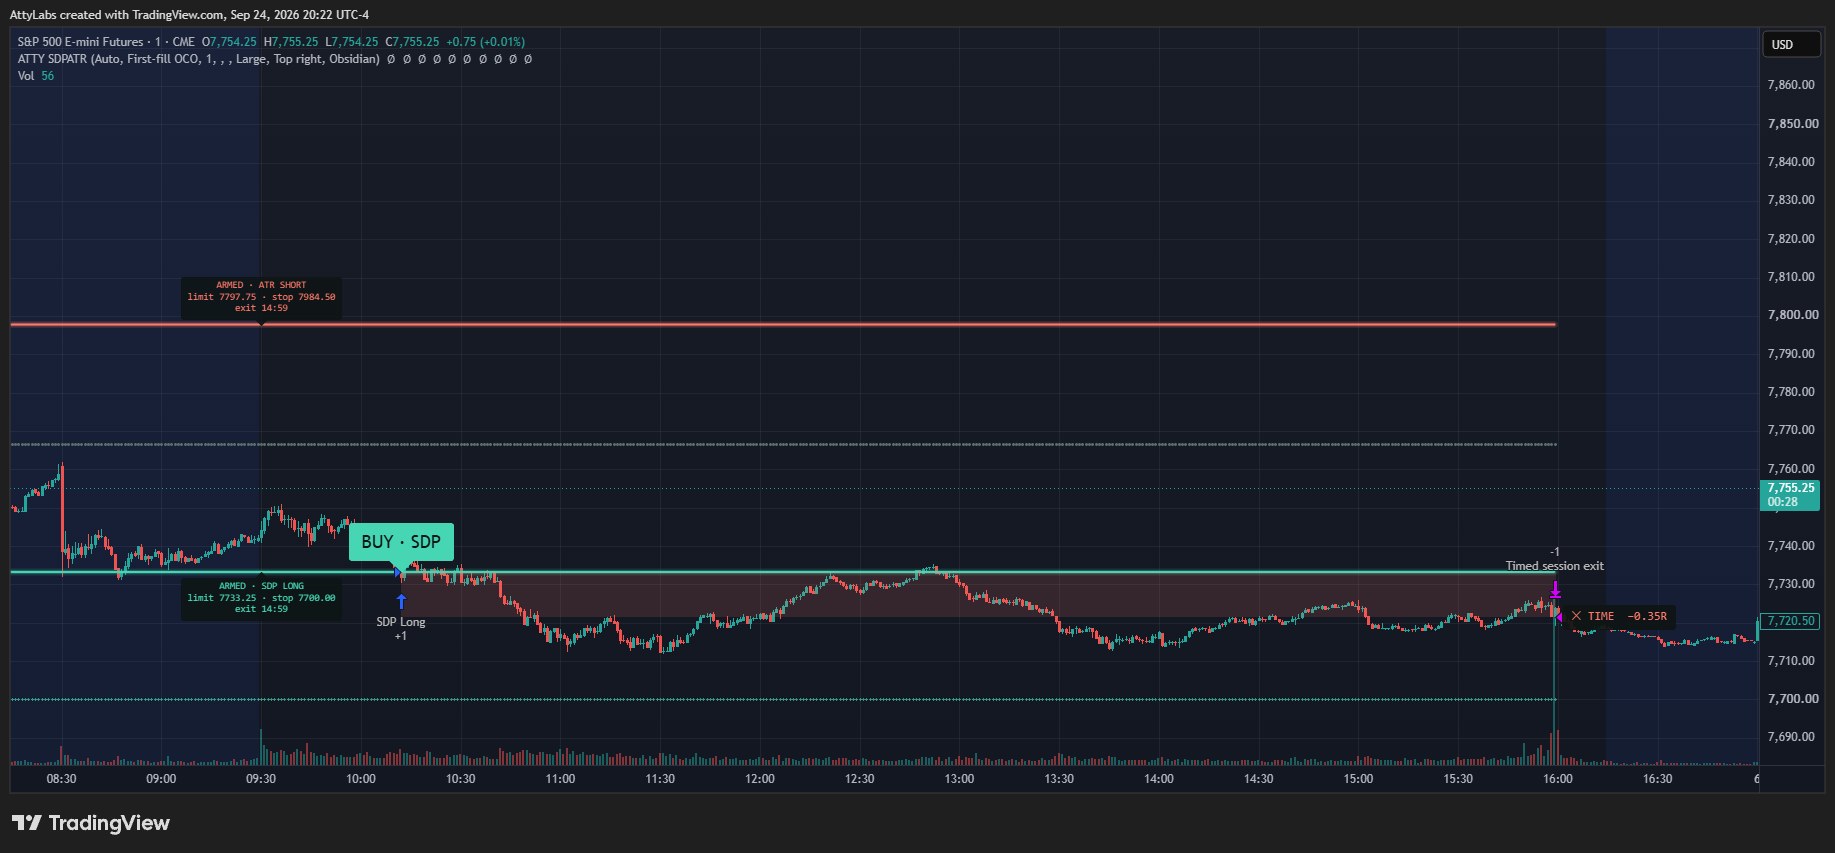
The strategy works on the chart you open. It does not scan the market and it does not choose a universe for you. A symbol that shows up on a screener is a candidate. The chart's setup panel is the final rule check.
1 · Choose a tradable universe
Start with the stocks, ETFs or futures contracts you can actually trade. Use your scanner's exchange, instrument type, price, average volume and liquidity filters to make that list practical for your account. For short stock setups, confirm your broker permits the short and that shares are available.
Those universe choices are yours, and they are selection rules in their own right — they do not replace the setup rules below. The strategy prescribes no minimum stock price, market capitalisation or dollar volume. Keep your universe choices consistent if you intend to judge results over time.
For futures, pick the contract you intend to trade and use its matching session preset. A continuous chart is useful for review, but its roll adjustments and volume history can differ from an individual expiry.
2 · Run the exact scan after the close
Every price and volume figure has to describe the same completed reference session. Call that session D.
| Symbol | Meaning |
|---|---|
| H, L, C, V | D's high, low, final close and total volume |
| Cprev | The preceding complete reference session's close |
| S | Wilder ATR(5) immediately before D — D's own move is excluded |
| G | Wilder ATR(5) immediately after D — D's move is included |
| M20 | Median volume of the 20 complete reference sessions before D |
For each valid session, true range is max(H − L, abs(H − Cprev), abs(L − Cprev)). Wilder ATR(5) starts as the mean of its first five valid true ranges, then updates as (4 × previous ATR + current true range) ÷ 5. Then:
The four lists
| List | Required conditions | What it enables next session |
|---|---|---|
| BIG UP | Move ≥ +1.00 | ATR Short reversal |
| BIG DOWN | Move ≤ −1.00 | ATR Long reversal |
| CLEAN UP | BIG UP, CloseRank ≥ 0.75, RelVolume ≥ 1.20 | Second Day Long, plus the ATR Short it already qualified for |
| CLEAN DOWN | BIG DOWN, CloseRank ≤ 0.25, RelVolume ≥ 1.20 | Second Day Short, plus the ATR Long it already qualified for |
Keep the BIG lists as well as the CLEAN lists. Strong volume and an outer-quarter close are requirements for the Second Day plays only; they are not extra requirements for the ATR reversals. Equality at a threshold qualifies.
The move is close to previous close, not open to close, so a gap-led session can qualify. Candle colour, a news catalyst, VWAP position and moving-average trend are not setup gates here.
Allow at least 50 valid true-range observations before D, plus the previous 20 complete volume sessions. Missing history, a zero session range or an unusable volume denominator means the setup cannot be evaluated yet.
If your screener only has ordinary fields
Use daily percentage change to find unusually strong gainers and losers, then use volume or relative-volume fields to prioritise what you review. Apply the strategy to that shortlist to get the exact decision.
An ordinary screener preset is not the same arithmetic. Four specific ways it differs:
- A fixed "up 3%" or "down 3%" threshold is not one prior ATR for every stock.
- A built-in ATR field may use a different length, session or smoothing, and may include D when the scan needs S from before D.
- A built-in relative-volume field usually compares against an average, or a time-of-day baseline. This scan uses the median of the preceding 20 completed reference-session volumes, excluding D.
- "Near the daily high" has to mean the top quarter of the high–low range to match CloseRank ≥ 0.75. It is not the same as being within a fixed percentage of the high.
An approximate shortlist can miss exact qualifiers. Reproducing the formulas above in a custom scanner is what it takes to scan a universe exhaustively.
3 · Install it and open the chart
- After checkout, open your Whop membership, type your exact TradingView username, click Set, then Claim Indicators. Access is added automatically, usually within minutes. Never share a password.
- Open a shortlisted symbol on TradingView and choose Indicators → Invite-only scripts → Atty SDP ATR Algo.
- Set the chart to ordinary one-minute candles. Heikin Ashi, Renko and other synthetic chart types are not valid for execution testing.
- Enable extended / full-session data, so the strategy can process the bars before the reference-session open and stage the next session's orders. The minute immediately before the open is the one that submits them.
- Choose the session preset that matches the instrument. Your chart's display timezone does not change the preset's market timezone.
- Load enough history for the warm-up, then read the setup panel for readiness and the qualifying setup names.
- Confirm the displayed entry, stop, quantity and scheduled exit before you place any real order.
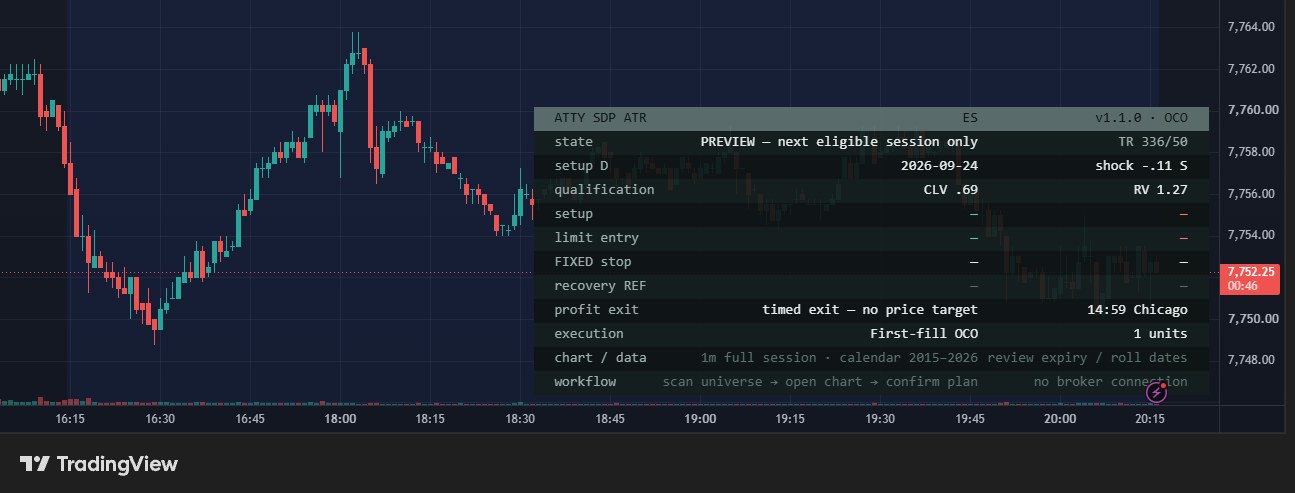
| Preset | Session used for the setup | Scheduled exit |
|---|---|---|
| US stocks / ETFs | 09:30–16:00 New York | 15:59 New York |
| ES | 08:30–15:00 Chicago | 14:59 Chicago |
| GC | 07:20–12:30 Chicago | 12:29 Chicago |
| CL | 08:00–13:30 Chicago | 13:29 Chicago |
Those are the strategy's reference windows. The futures windows are deliberately not the whole electronic trading day. Extended data supplies the surrounding chart bars; it does not add overnight prices or volume to the setup session.
Each setup belongs to the immediately next trading session and expires at that session's cutoff. An unfilled order is not carried forward as tomorrow's trade. Shortened holidays, missing bars and halts need attention to the real market schedule — the built-in calendar covers 2015–2026 and the strategy refuses to activate outside that range rather than guess.
4 · Read the four setup cards
Midpoint = (H + L) ÷ 2. Entries and stops are fixed from D. They do not chase today's price.
| Setup | Qualification | Limit entry | Fixed stop | Recovery reference |
|---|---|---|---|---|
| SDP Long Second Day Long | CLEAN UP | Buy at D's midpoint | D's low | D's high |
| ATR Long Downside reversal | BIG DOWN | Buy at L − 0.5 × G | L − 3.5 × G | D's low |
| ATR Short Upside reversal | BIG UP | Sell at H + 0.5 × G | H + 3.5 × G | D's high |
| SDP Short Second Day Short | CLEAN DOWN | Sell at D's midpoint | D's high | D's low |
The platform rounds levels to the instrument's tick size: buy limits and long stops down, sell limits and short stops up. The final directional entry-to-stop distance must be at least one tick.
The ATR stop is 3.5 G beyond yesterday's extreme, which puts it 3 G away from the unrounded entry. It is not 3.5 G from entry.
Worked example — a strong upward session
D has a high of $110, a low of $100 and a close of $109. The preceding close was $103, prior ATR S is $5, updated ATR G is $6, and relative volume is 1.4.
- Move = (109 − 103) ÷ 5 = 1.2 — BIG UP qualifies.
- CloseRank = (109 − 100) ÷ 10 = 0.90 and relative volume clears 1.2 — CLEAN UP qualifies too.
- SDP Long: buy limit $105, fixed stop $100, recovery reference $110.
- ATR Short: sell limit $113, fixed stop $131, recovery reference $110.
Both plans appear on the chart. Under the default first-fill rule, whichever entry fills first cancels the other for that session.
5 · Entry and exit behaviour
What the chart marks
Before the open, each setup that armed gets a dark ARMED chip at its limit, for example ARMED · SDP LONG, with the limit, the fixed stop and the exit time. That is a pending order, not a fill. Most armed limits are never reached.
If price trades to a limit, a solid BUY or SELL tag (BUY · SDP, SELL · ATR and so on) points at the fill price on that bar. Where the trade ends, a second tag says how it closed, TIME for the scheduled exit or STOP for the fixed stop, and gives the result in R, measured from the fill to the fixed stop. The trade is shaded from entry to exit.
TradingView also draws its own small order arrows. To see only these tags, open the strategy's Settings → Style and untick Trades on chart. Tag size is under 3 · Display → Signal size.
First fill wins
The default executable strategy is first-fill OCO — one cancels the other. Both qualifying cards can be visible, but the first entry filled cancels its sibling. The strategy never holds opposing positions, and it does not re-enter after that trade closes during the same setup session.
This is the separately tested OCO execution variant. The research baseline used independent cards that could book both opposing trades; a TradingView strategy holds one net position, so its trade count is not a reproduction of that baseline.
Fixed stop, then a timed exit
There is no take-profit order in this release. The design is a fixed protective stop plus a close of any remaining position one minute before the reference session ends.
The recovery line marks where price would have returned to a prior-session extreme. It is labelled reference, and touching it does not close the trade. It is not a hidden target, and it is not a promise that price will get there.
After entry, if you intend to follow this release: keep the original stop fixed, add no target, trail, break-even move, partial exit, averaging or re-entry, cancel any unused entry at the cutoff, and close what remains at the scheduled exit at whatever price the market is actually offering.
6 · What the Strategy Tester means
The strategy simulates orders on the symbol and history you have loaded. Adding it to a chart places no broker orders and no broker connection exists. Review position sizing, commission, slippage and the displayed session before you read anything into its results or trade the levels by hand.
One-minute historical bars do not reveal every price sequence, and TradingView's broker emulator and chart data can differ from our own research replay. Gaps can fill or exit beyond a displayed level. Continuous futures rolls, incomplete sessions and missing pre-open data can all affect the setup or the order lifecycle.
The scope we claim. The playbook was researched on existing ES, gold and crude data. That study had limited samples, and a broader scanner-selected stock universe has not been validated. What the strategy gives you is a consistent way to display, simulate and record the playbook on charts you selected — not a demonstrated edge on stocks.
7 · The daily checklist
After the close
- Scan both BIG UP and BIG DOWN.
- Tag CLEAN UP and CLEAN DOWN with the exact close-rank and median-volume rules.
- Keep a shortlist drawn from your chosen tradable universe.
Before the next reference session
- Load each candidate's ordinary one-minute chart with full/extended data.
- Select the correct session preset and confirm there is enough history.
- Read the actual qualifying setup name, limit entry, fixed stop and scheduled exit.
- Check the real session schedule and your broker's trading and short-sale availability.
During the session
- Follow the first-fill OCO plan.
- Treat the recovery line as a reference only.
- Keep the stop fixed, and flatten at the cutoff if the position is still open.
Afterward
- Record the universe selection, the setup, the actual fill, costs and exit.
- Expire that session's cards and run the scan again on the next completed setup session.
Where to get it
Atty SDP ATR Algo is included in the Atty Algo Pack subscription — $89 a month, $231 a quarter or $854 a year, the whole pack together. There is no standalone purchase and no free version. The TradingView listing is public; access and source are not.
Atty Labs is not an investment adviser. Nothing on this page is financial advice or a recommendation to trade. See the disclaimer, terms and refund policy.