Atty Labs Free Tools

Eleven free indicators.
Open source. No email required.

Every one of these is published in the TradingView public library. Click a tool, hit Add to chart, and it is on your chart in a few seconds. You can read the entire source before you run it. There is no invite to wait for, no email to hand over, and none of them is a crippled version of something we sell.

Open source, readable Confirmed bars only No repainting after close No performance claims
New · The Backtester That Argues With Itself

Atty Strategy Seeker

It searches up to 1,536 strategies on your chart, ranks them, and then spends most of its panel explaining why the winner probably means nothing. That second half is the tool.

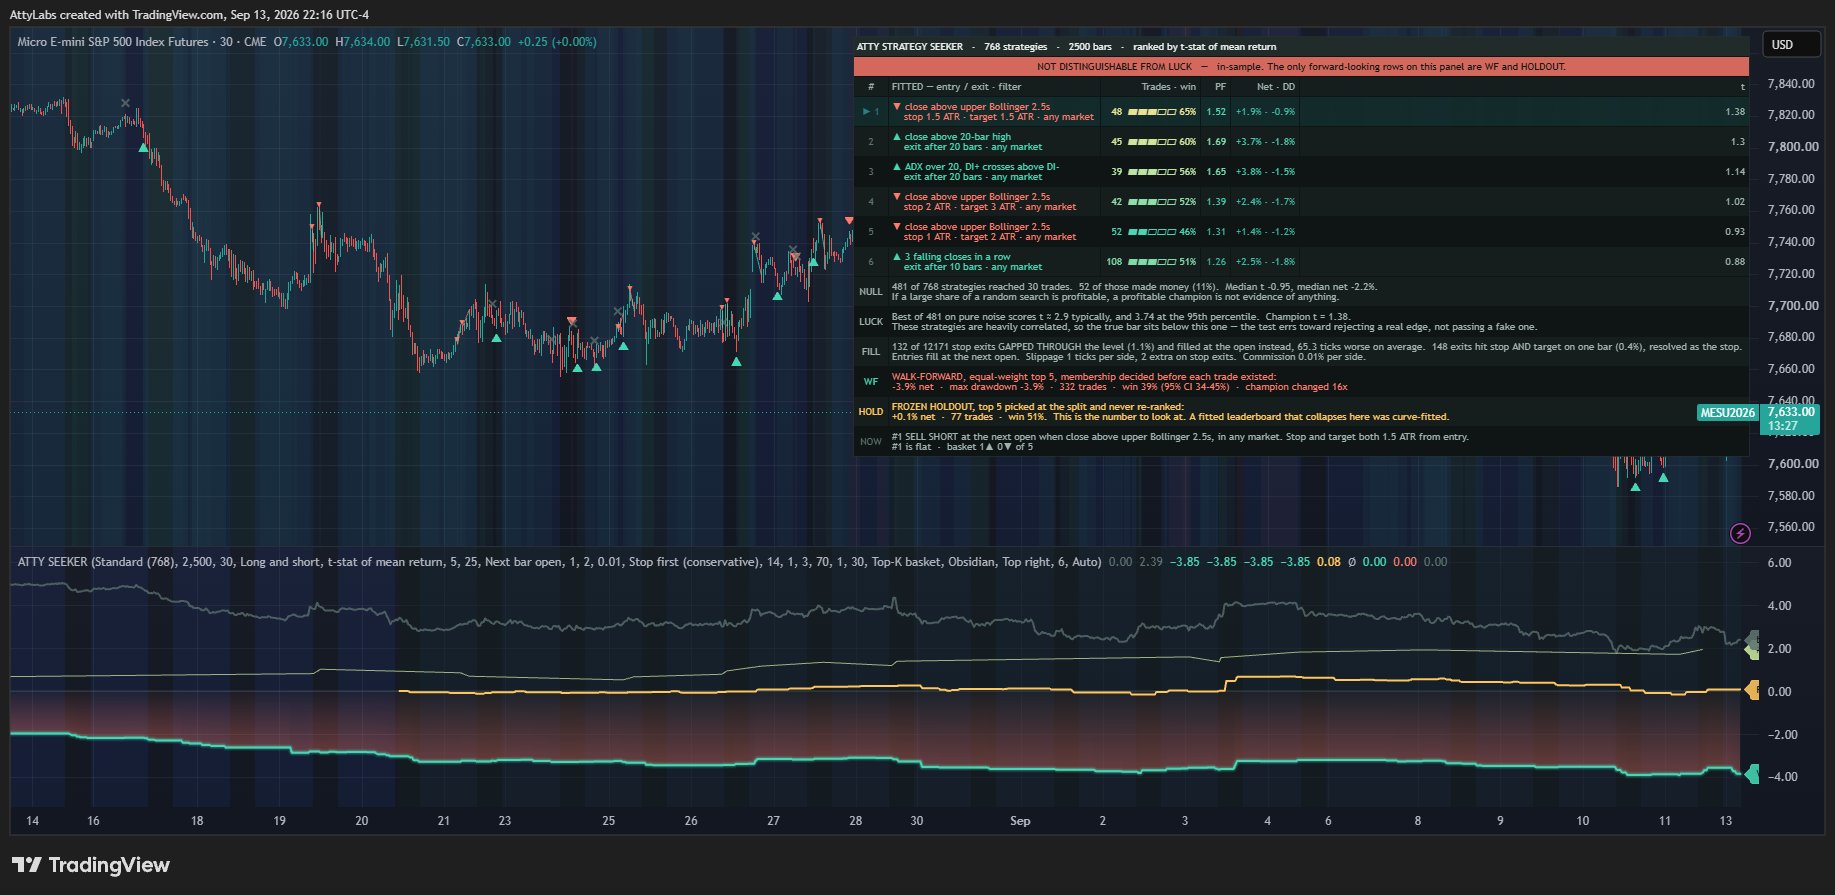
Atty Strategy Seeker on a 30-minute MES chart, showing the fitted leaderboard above the luck bar, null distribution, fill diagnostics, walk-forward and frozen holdout rows
MES 30-minute, 768 strategies over 2,500 bars. The best one scores a t-statistic of 1.38. The best of 481 qualifying strategies on pure noise would score about 2.9. The panel says so, in the row marked LUCK, instead of leaving it out. Of the 481, 52 made money — 11%.

Fills that can gap through

A backtest that fills a stop at the stop deletes its own left tail. Here a stop pays the worse of the level and the bar open, stop exits pay extra slippage, and the panel prints how many stop exits gapped straight through and how many ticks worse they really filled. On the chart above: 132 of 12,171, costing 65 ticks each.

Nothing knows the close early

A signal read from a bar's close is not knowable until that close prints, so entries fill at the next bar's open. Trailing stops test the level carried in from the previous bar before ratcheting on this bar's close — the reverse order is the most common intrabar look-ahead in published strategy scripts, and it always flatters the result.

The best of N is not an estimate

It is the maximum of N draws. So the panel prints what the best of N scores on noise, how many of the N made money at all, a walk-forward basket credited only from trades whose strategy was already ranked in beforehand, and a holdout frozen at a split point and never re-ranked.

Add Strategy Seeker to a chart →

Everything in-sample is labelled FITTED, including the leaderboard. The drawn trades of the selected row carry a stamp on the chart saying they are there because they won. It makes no performance claim, and a result it likes is still in-sample.

Risk and Sizing

Before the trade.

Atty Risk Ruler

Click your entry, click your stop, and it does the rest: size in whole shares or contracts, total risk in money and as a percent of the account, and an R ladder with the dollar value at each rung. The break-even line sits at your entry plus the round turn, not at your entry — which is further away than most people expect on a tight stop.

Add to chart →

Atty Prop Challenge HUD

The rules of a funded-account evaluation, drawn, while you still have time to do something about them. Every trading day is a column and the consistency ceiling runs across them, because that is the rule that quietly ends most attempts. When your best day is over the line it prints the number nobody calculates: how much more total profit makes that day legal.

Add to chart →

Structure and Levels

Where the market has been doing business.

Atty Key Levels

The session levels that actually get traded — prior high and low, overnight range, the opens, settlement, prior value area and point of control, RTH VWAP and the initial balance. Session math uses explicit New York times, so your levels do not move when your chart timezone does.

Add to chart →

Atty ORB Macros

Draws the opening range and tracks each breach against a Daily / 4H / 1H macro bias dashboard. Deliberately neutral: it monitors and reports, and it does not print entries, targets or projected R. That restraint is what makes it safe to hand out.

Add to chart →

Atty Moving POC Average and Projection

One session's point of control is a single number. This collects that number from every session on the chart and runs moving averages through the series, so you get a slow estimate of where business has been done and which way that centre is drifting — plus a forward path and a probability fan that narrows as the session fills in.

Its own listing says plainly that the line is not a forecast of the next POC, and gives the measured miss that proves it.

Add to chart →

Atty Gap Map

Sizes every gap against the median gap this symbol makes, so one setting behaves the same on a five-dollar stock and an index future. Then it reports what has historically happened to gaps that size: same-bar fill rate, fill rate inside your window, average bars to fill, and how often the day closed away instead. Unfilled gaps stay drawn and fade with age.

Every figure is accumulated causally, bar by bar. Below the minimum sample it says so instead of printing a percentage.

Add to chart →

Volatility, Trend and Flow

What is normal, and what is not.

Atty Expected Move Cone

A 0DTE option prices one thing: how far price can travel between now and the settle. That number shrinks all day. This draws it — a cone that re-anchors to price and contracts into the closing bell. It decays on a measured variance clock, because the first hour carries 28% of a session's variance where a flat clock would say 15%.

Level comes from VIX1D, a hand-typed straddle, or realised dispersion. Bands are drawn at measured containment rather than Gaussian multiples.

Add to chart →

Atty Noise Area

Shades the range where price is behaving normally for this minute of the day, so an unusual move looks unusual. Implements the Noise Area from the published Zarattini, Barbon and Marchioro intraday momentum paper, with attribution kept in the source.

The paper's evidence was measured on SPY only, and no independent adversarial replication of it exists either way. The listing says both.

Add to chart →

Atty Algo Trend Pro

A two-line trend ribbon where the colour, not the lines, carries the read. The gap between the averages has to clear an ATR-scaled neutral zone before the ribbon commits, so one setting behaves the same on gold, the Nasdaq and a five-dollar stock. A session gate holds the call until the open has settled, because the opening drive lies about direction.

Add to chart →

Atty Short Volume

The share of a stock's daily volume executed as short sales, as reported by FINRA, against its own recent baseline.

This is short sale volume, not short interest and not short float. A 55% reading does not mean 55% of the float is short. The two get confused constantly, so the listing leads with the distinction rather than burying it.

Add to chart →
How They Are Built

The rules every free tool follows.

We took apart the five most-boosted scripts on TradingView. Three of them mislead about what was knowable at the time — they look ahead on history, or their signal quietly changes before the bar closes. None of them express their output in units you can compare between symbols. All of them compute something continuous and then throw it away. So we wrote down the opposite.

What you scroll back to is what was live

Everything evaluates on confirmed bars, and any higher-timeframe value is taken from the last closed bar of that timeframe. No signal appears in history that was not on screen at the time.

Numbers that compare across symbols

Output is expressed in volatility units, percent of price, or a trailing percentile of the symbol's own history — never raw price units, which mean nothing from one chart to the next.

Nothing throws away what it measured

Where a tool computes a continuous quantity, it shows that quantity. States can be read off it, but they never replace it. "Not readable right now" is a legitimate answer.

No performance claims, ever

These are measurement and drawing tools. Not one of them claims a win rate, a profit factor or a return. Where a tool rests on published research, the listing names the paper and its limits.

Every script is open source. You can read the whole thing on TradingView before you run it.

Ready for the full pack?

The Atty Algo Pack — Stampede, SDP ATR, Execution Reality and Session Map on one subscription, each tested on years of market data.