Atty Labs builds trading algorithms that mark the entry, the stop and the profit target the moment a bar closes — and ship with the full tester run that earned them a price. No repainting. No vanishing arrows.
The same settings on every symbol, commission and slippage inside the numbers, no per-symbol tuning and no cherry-picked window.
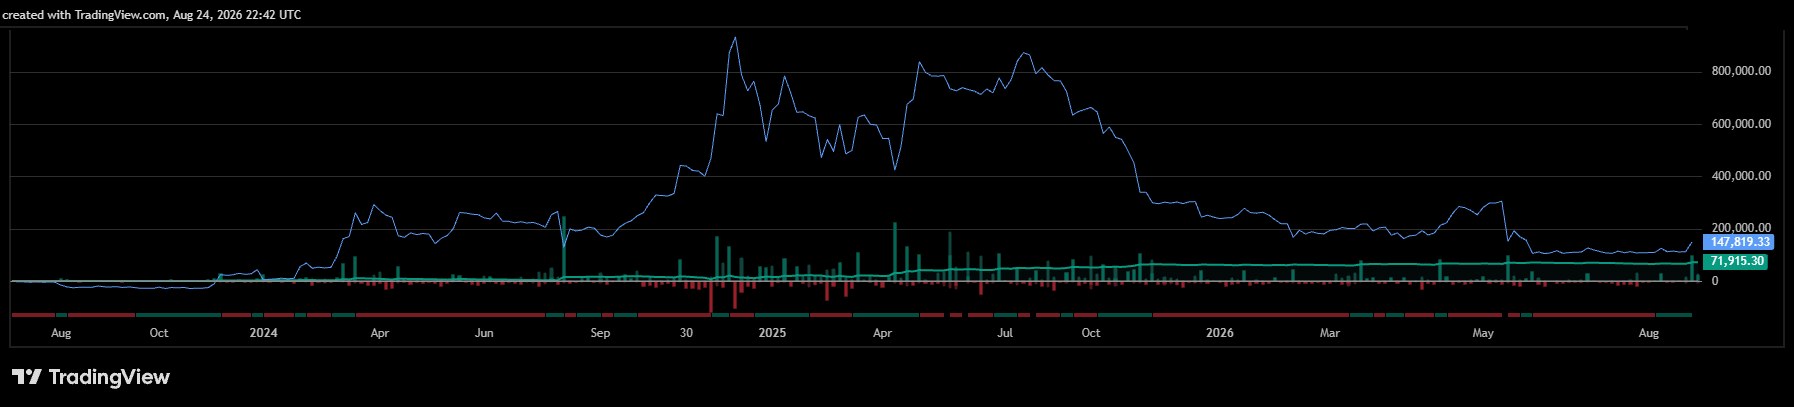
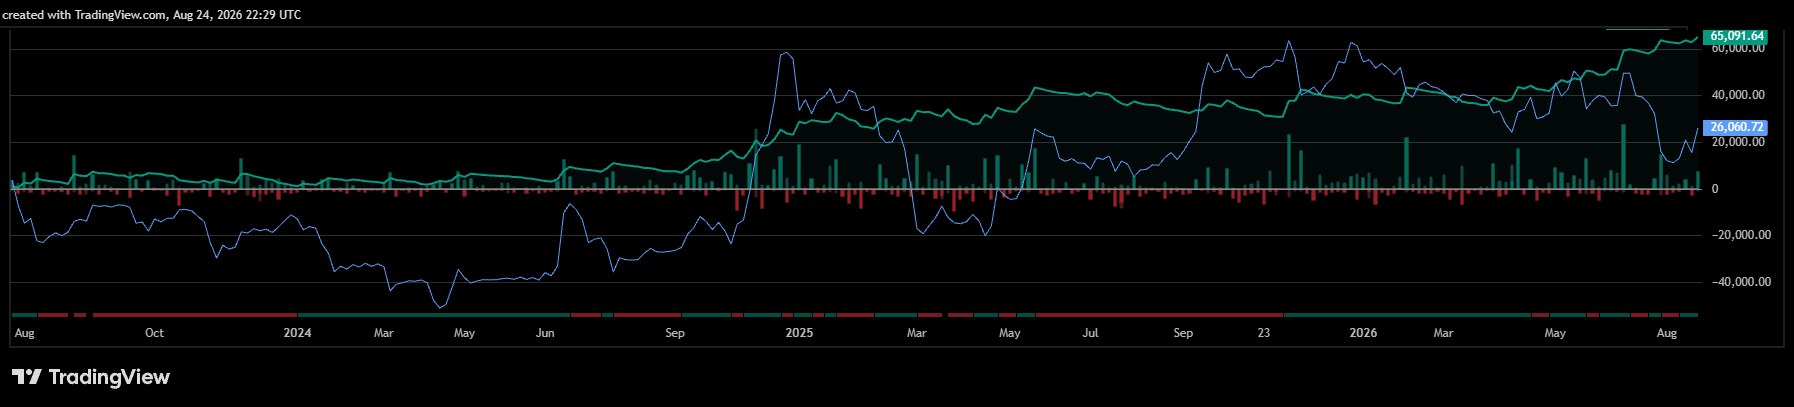
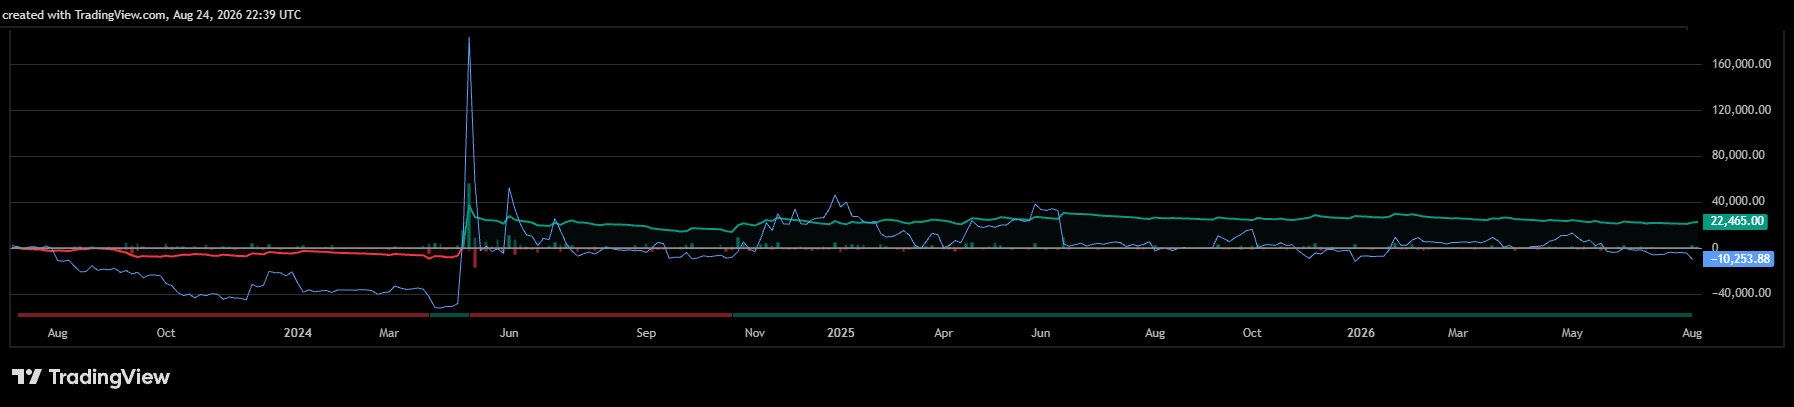
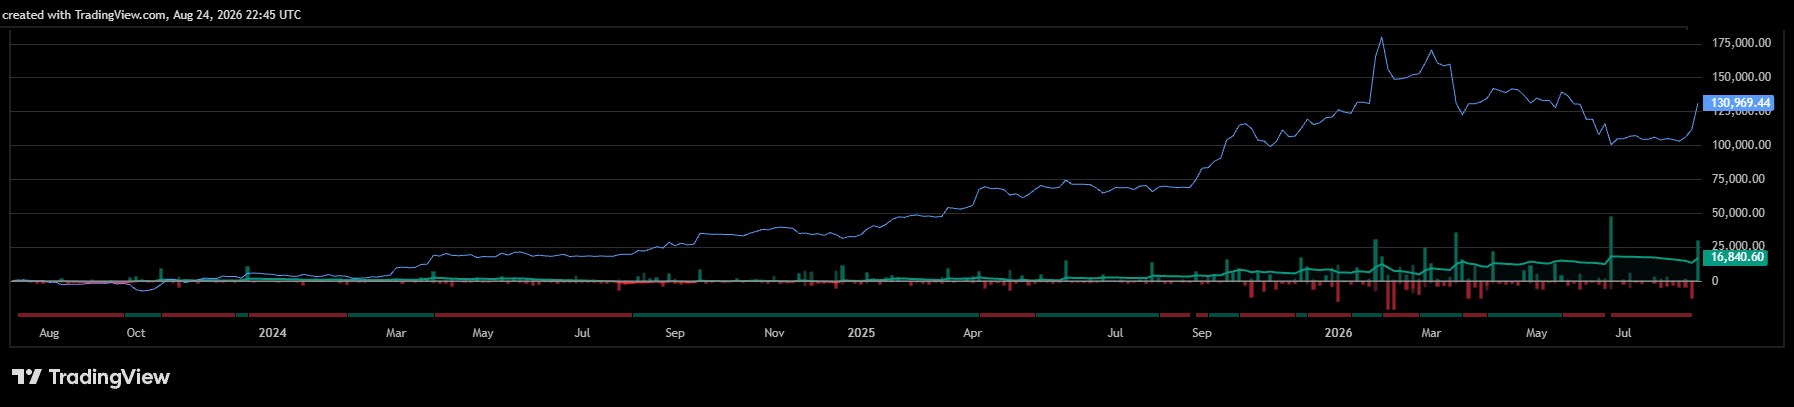
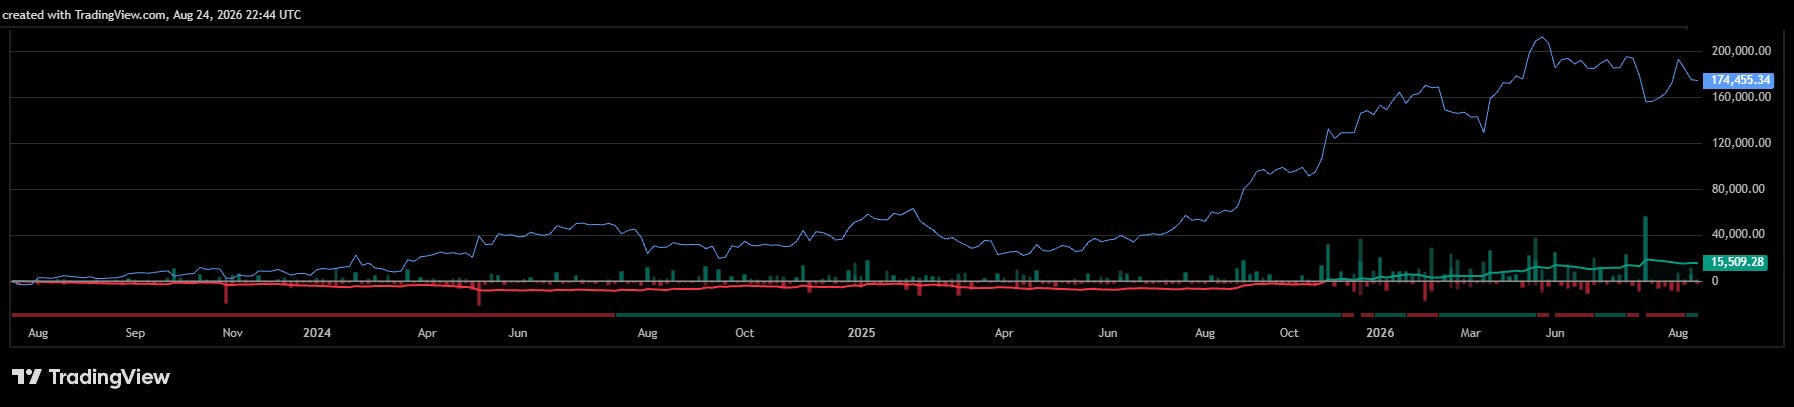
TradingView Strategy Tester · Jul 3 2023 – Aug 24 2026 · 15-minute chart · $100,000 simulated account · fixed size (100 shares; GME 1,000) · $0.005/share commission · 1 tick slippage · limit entries. These are hypothetical results on historical data. Every tester screenshot →
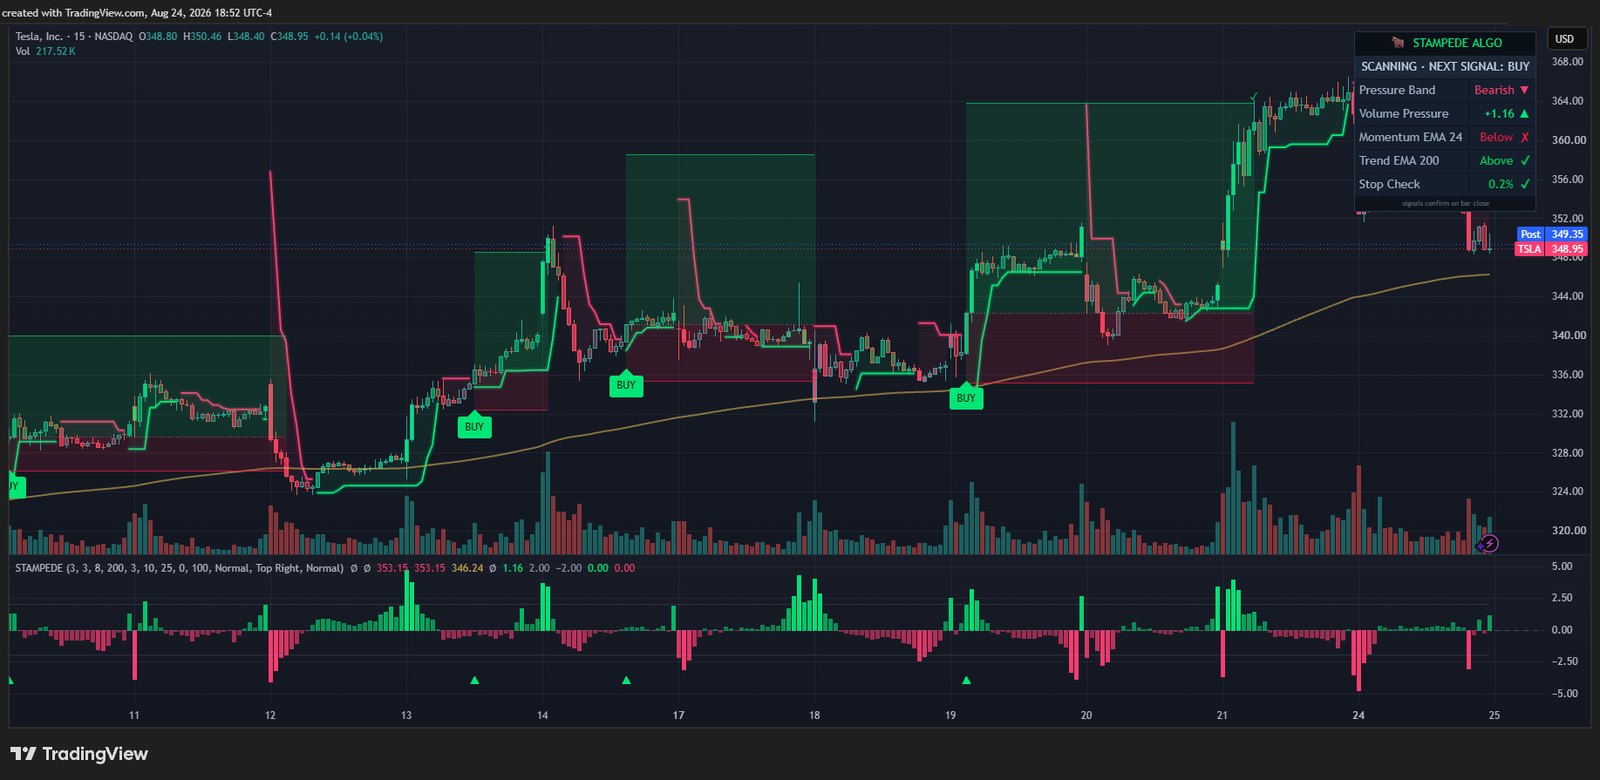
Scroll and the chart pushes in. Every line the algo puts down is a line you can question.
An adaptive trailing band that tracks how hard volume is pushing price. Break it with the trend gates agreeing and the signal fires.
BUY and SELL print when the bar completes and never move afterwards. History shows you what you would actually have seen live.
Placed at the recent 10-bar swing and drawn as a zone with a live price tag, so the risk is on the chart before you take the trade.
Set at three times the distance to the stop, every time. Winners are sized to pay for a long run of small stops — which is why a sub-30% hit rate still carries.
The paid side of Atty Labs is not one product. It is strategies that take trades, each sold on its own and shipped with the backtest record that earned it a place; the Atty Algo Pack, a growing set of research-backed tools on one subscription; and eleven free, open-source tools that stay free and never turn into limited versions of something paid. Status is stated plainly: shipping, in testing, or free.
One subscription covers every tool in the set, and every tool added to it later. Most of them measure rather than signal; the one strategy in the set is labelled as one.
$89 / month · four tools now, more landing
TradingView tools built from our own market research. Every tool is tested on years of real market data before it ships. Backtests include commission and slippage, the settings are disclosed, and we publish the research behind each tool, including the results that didn't hold up. Stampede and SDP ATR trade; Execution Reality and Session Map measure.
These take trades, and each ships with its backtest record. Stampede is included in the Algo Pack; the rest are in testing or free.
Volume-pressure trend engine
Measures how hard volume is pushing price and which way. When pressure breaks the adaptive band and both trend gates agree, it prints BUY or SELL at bar close and draws the stop and target automatically.
Opening-range breakout engine
Trades the break of the opening range on index futures with a confluence filter and a fixed risk model. It is running live in a paper account right now, building the forward record that has to exist before it goes on sale.
Not for sale until the forward record existsDual-MA trend ribbon
Two moving averages ride with price and the ribbon between them carries one color, set by how far apart they are. An adaptive neutral zone keeps it quiet in chop, and a session gate holds the read until the morning settles.
Free and open source →Session structure mapper
Plots the reference levels that actually get traded — prior session high, low and close, the overnight range, and the opens — using explicit New York session times so the levels are the same no matter what timezone your chart is set to.
Free and open source →Opening range + macro bias
Draws the 30-minute opening range and tracks every breach against a Daily / 4H / 1H trend dashboard. Deliberately neutral — it monitors and reports, it does not generate entries, targets, or trade signals.
Free and open source →Time-of-day volatility envelope
Compares the current move against what this same minute of the day normally does, and shades the band where price is behaving normally. An implementation of the Noise Area from the published Zarattini et al. intraday momentum paper, with attribution.
Free and open source →FINRA short-sale volume, as a percentage
Plots the share of each day's volume that was short-sale volume, with a smoothed average and a marker for elevated readings. Short-sale volume is not short interest and it is not short float; the script says so, because the three get confused constantly.
Free and open source →Session point of control, averaged and projected
Takes the point of control from every session, runs a moving average through the series, and projects it forward inside a probability fan that tightens as the day fills in and closes to a point at the bell. The listing also states, with numbers, what the line cannot do.
Free and open source →0DTE expected move, decaying to the close
Draws the move still to come between now and the session close, contracting all day the way an option's time value does. It decays on a measured intraday variance profile rather than the wall clock, and learns from the variance the session has actually delivered.
Free and open source →A strategy search that reports its own odds of being noise
Tests up to 1,536 simple strategies on your chart and ranks them — then prints what the best of that many would have scored on pure noise, how many of them made money at all, a walk-forward basket, and a holdout frozen before the winner was known. Stops pay the worse of the level and the bar open, and the gap-through rate is on the panel.
Free and open source →Position size and R ladder, click-to-place
Click your entry, click your stop. It returns the size in whole shares or contracts, the total risk in money and as a percent of the account, and an R ladder with the dollar value at each rung. The break-even line sits at your entry plus the round turn, which is not where most people think.
Free and open source →Funded-account rules, drawn
Every trading day is a column and the consistency ceiling runs across them, because that is the rule that quietly ends most evaluations. When your best day breaks it, the panel prints how much more total profit makes that day legal. Target and drawdown floor sit alongside it as gauges.
Free and open source →Gaps, sized against the symbol's own history
A 2% gap is ordinary in one name and a once-a-year event in another, so each gap is measured against the median gap this symbol makes. Then it reports the fill rates that followed gaps that size — all accumulated causally, and withheld entirely when the sample is too small to mean anything.
Free and open source →More algos are in the build queue. Every one of them goes through the same gate before it gets a price: a full backtest with the settings published, and the markets where it failed disclosed rather than quietly dropped.
Most indicator shops show you one screenshot of one good day. Here is the bar every Atty Labs algo has to clear instead.
Not a cropped equity curve. Net profit, profit factor, trade count, drawdown — the same panel you would see on your own chart, from the exact settings we publish.
Commission and slippage are in the backtest before we look at it, not bolted on after. An edge that only exists gross gets killed internally rather than sold.
Each algo has markets it is wrong for. We say which ones, and why.
A signal that prints on a closed bar stays on that bar. If a tool needs the future to look good in a screenshot, it is not going in the catalog.
Backtests are where an idea earns a test, not where it earns a price. Algos marked "in forward testing" are running in a paper account and are not for sale until that record exists.
The fastest way to see how Atty Labs builds. No email, no invite to wait for, and nothing crippled — every one is published in the TradingView public library, and you can read the whole script before you run it.
Strategy Seeker · Risk Ruler · Prop Challenge HUD · Gap Map · Key Levels · ORB Macros · Moving POC Average · Expected Move Cone · Noise Area · Algo Trend Pro · Short Volume — all on confirmed bars, all readable, and not one of them claiming a win rate.
Market studies with the method and the sample size attached — including the ones that failed. Latest: what actually happens to SPY on a Fed decision day, measured across 212 of them.
A research shop that builds trading algorithms, tests them against controls, and sells the ones that survive. The tools run as scripts on TradingView charts, so you keep your own broker, your own account, and every decision — nothing here places a trade for you.
The eleven free tools are published open-source in the TradingView public library. Open the listing, click Add to chart, and it is running — and you can read the whole script before you do.
Checkout runs on Whop, which handles the payment, your receipts and your membership. After you pay, your Whop membership page shows a box for your TradingView username: type it in, click Set, then Claim Indicators. Whop adds every tool in the pack to that account through TradingView's invite-only system, usually within minutes. We never ask for your TradingView password. The tools then appear under Indicators → Invite-only scripts on any chart you open.
Your Whop account is also where you manage the subscription: download receipts, switch plans or cancel in a couple of clicks, with no email to us needed. If you cancel, access stays until the end of the period you paid for, and Whop removes it automatically after that.
No — the scripts run on the free plan. TradingView caps how many indicators and active alerts you can run per chart, and those caps are tighter on the free tier, so a paid TradingView plan gives you headroom if you stack several tools at once. That subscription is TradingView's own and separate from anything here.
They have not cleared the testing bar yet. An algo marked "in forward testing" is running in a paper account and building a live record. Listing it early is deliberate — you get to see what is coming and watch it prove out, rather than meeting a product for the first time on its launch day.
Next up is Atty Prop ORB, built around the rules of prop-firm evaluations, with an anticipated release of 10 October 2026.
No. These are analytical charting tools — the labels and levels are the output of a formula applied to price and volume, not recommendations. Atty Labs is not a registered investment advisor, broker-dealer, or commodity trading advisor, and every decision stays yours. Full detail in the Risk Disclaimer.
Yes. The catalog is built to grow, and a tool ships when it clears the bar described in How We Test. Join the notify list and you hear about each one first.
Eleven open-source indicators you can put on a chart in the next two minutes, and a clear look at how this lab works before you spend anything.
Risk Disclaimer: Trading stocks, futures, forex, and cryptocurrencies involves substantial risk of loss and is not suitable for every investor. You can lose some or all of your invested capital. Atty Labs tools are charting aids for education and analysis — they are not investment advice, and Atty Labs is not a registered investment advisor, broker-dealer, or commodity trading advisor. Any performance figures shown on this site are hypothetical, generated by TradingView's strategy tester, and are subject to the limitations described in our full Risk Disclaimer, including the CFTC Rule 4.41 disclosure. Past performance, whether actual or hypothetical, is not indicative of future results. You alone are responsible for your trading decisions. TradingView® is a registered trademark of TradingView, Inc. Atty Labs is not affiliated with, endorsed by, or sponsored by TradingView.